
October 1996 € Volume 6 € Number 10
October 1996 € Volume 6 € Number 10
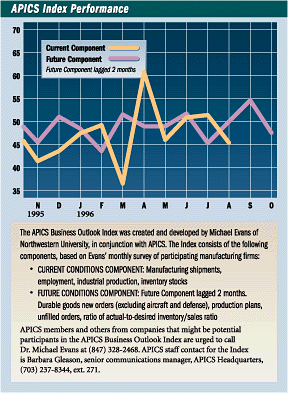
T he APICS Business Outlook Index fell to 46.4 in August, down from 53.0 in July. The Current Component fell to 45.4 from 51.4, with the Future Component down to 47.4 from 54.7.
Last month we emphasized that the rise in July was due to fewer firms shutting down production facilities, as well as the fact that the economy was still fairly robust. The August figures must also be interpreted in that light: The declines in shipments, orders, and production in August reflect fewer start-ups this month than usual, so the seasonal swing is smaller.
For this reason we ought to consider the average value of the index over the past two months, which is 49.7, compared to 50.6 in the second quarter. Seen in this light, the growth in manufacturing activity has remained almost steady over the past five months.
Although current production leveled off in August, production plans remain strong, pointing to a fairly robust fourth quarter. Furthermore, the employment index has risen above 50 for the first time in a year, excluding the April gain when General Motors strikers returned to work. Firms would not be adding to the employment roles if they did not think business activity would remain strong.
Thus the decline in shipments, new orders and production is seen primarily as an offset to July. The 2.5 percent rise in durable goods new orders, excluding defense and aircraft, was far higher than expected, but it should be kept in mind that before seasonal adjustments, that figure fell 17.1 percent. This is not a criticism of the seasonal adjustment procedure. We merely point out that in July, the drop in orders was not quite as large as usual because more plants stayed open; so in August, the gain in orders will not be quite as large as usual because fewer plants have reopened.
It is in this spirit that the reported decline in activity should
be interpreted, not as a sign of a general slowdown in the months
ahead. For if this were the case, we would have seen a drop in
production plans, further declines in employment, and probably an
oversupply of inventories. In fact the August survey shows just the
opposite.
Current Conditions Component
Future Conditions Components
Understanding the APICS Index
Last month we received a number of calls wondering why the APICS index for July went up when the NAPM index went down. The implication was that the APICS index was somehow "wrong," a feeling that was intensified after the July BLS employment and earnings report was less robust than expected and interest rates plunged, because of the revised consensus belief that the Federal Open Market Committee (FOMC) would not tighten at its Aug. 20 meeting. That did indeed turn out to be the case.
However, it turned out that the industrial sector for July was more robust than was indicated by the NAPM report and the manufacturing sector statistics reported by BLS. Production rose 0.3 percent; and in the durable goods sector, shipments were up 0.7 percent, unfilled orders rose 1.0 percent, new orders were up 1.6 percent, and excluding aircraft and defense, soared 2.5 percent. That latter figure convinced many financial market analysts that the economy was not so weak after all.
In August, the employment and earnings report will probably show a big increase in employment and hours. However, that will probably be followed by no gain in manufacturing production and a downturn in shipments and new orders. Throughout the month we will have the usual cross-current of knee-jerk reactions from financial market gurus, although no change in Fed policy.
These recent developments should make it clear that no one indicator presents a comprehensive picture of where the total economy, or even the manufacturing sector, is heading in the near term. In particular, there is no reason why the APICS and the NAPM indexes should report the same results every month.
Specifically, the APICS index is supposed to accomplish two goals. The Current Conditions Component is supposed to provide an advance reading on what various key government statistics&emdash;especially employment, production, and new orders&emdash;will show over the next month or two. That part of the index is designed for very short-run decisions in both manufacturing and financial planning.
The Future Conditions Component, on the other hand, is designed to show where the manufacturing sector is likely to be heading over the next three months. For those who are interested in monetary policy, it is the future conditions component that is more likely to relate to FOMC decisions.
It is in this light that the August APICS index&emdash;like previous months&emdash;should be evaluated. In the very short term, the index says that the temporary upsurge in July in production, shipments and orders was related more to changes in summer vacation plans than to a switch in the overall economy, and the August levels should return to normal. As a result, some of the key economic indicators, although not employment, are likely to show a temporary decline this month.
The Future Component Index shows that production planning has actually improved, and that the actual to desired I/S ratio does not show any signs of excess inventory stocks.
Thus the APICS index continues to show that the rise in interest rates during the first half of this year has had only a modest impact on the economy, and real growth is likely to remain at above average rates through the end of this year.
If you're having trouble reading the text at the bottom of this graph, click here.
|
Maximum feasible value = 100 | ||||||
|
CURRENT COMPONENT | ||||||
|---|---|---|---|---|---|---|
|
|
SHIPMENTS |
EMPLOYMENT |
PRODUCTION |
INVENTORY |
CURRENT COMPONENT |
TOTAL APICS INDEX* |
|
1995 | ||||||
|
SEP |
56.9 |
48.6 |
58.5 |
54.8 |
54.7 |
50.1 |
|
OCT |
57.1 |
42.8 |
46.6 |
46.0 |
48.1 |
49.5 |
|
NOV |
56.6 |
34.6 |
38.9 |
35.3 |
41.3 |
44.8 |
|
DEC |
43.4 |
43.3 |
44.4 |
44.1 |
43.8 |
43.8 |
|
1996 | ||||||
|
JAN |
59.7 |
42.1 |
50.0 |
37.9 |
47.4 |
49.4 |
|
FEB |
58.6 |
40.9 |
61.1 |
37.1 |
49.4 |
49.2 |
|
MAR |
34.8 |
43.3 |
37.0 |
31.8 |
36.7 |
42.9 |
|
APR |
73.0 |
55.6 |
73.2 |
43.2 |
61.3 |
56.2 |
|
MAY |
53.5 |
43.3 |
41.7 |
45.7 |
46.1 |
45.6 |
|
JUN |
51.5 |
43.5 |
57.1 |
48.5 |
50.2 |
50.1 |
|
JUL |
58.7 |
45.6 |
57.7 |
43.7 |
51.4 |
53.0 |
|
AUG |
42.9 |
52.5 |
46.3 |
39.9 |
45.4 |
46.4 |
|
FUTURE COMPONENT | |||||
|---|---|---|---|---|---|
|
|
NEW ORDERS |
UNFILLED ORDERS |
PRODUCTION PLANNING |
I/S RATIO |
FUTURE COMPONENT |
|
1995 | |||||
|
SEP |
51.5 |
44.6 |
43.3 |
43.1 |
45.6 |
|
OCT |
51.9 |
48.0 |
48.3 |
55.7 |
51.0 |
|
NOV |
45.3 |
39.6 |
55.4 |
53.1 |
48.3 |
|
DEC |
37.1 |
45.5 |
50.0 |
42.6 |
43.8 |
|
1996 | |||||
|
JAN |
48.2 |
43.1 |
52.1 |
61.7 |
51.3 |
|
FEB |
50.2 |
39.7 |
45.9 |
60.0 |
49.0 |
|
MAR |
50.0 |
51.5 |
53.6 |
40.9 |
49.0 |
|
APR |
55.6 |
36.5 |
48.4 |
64.2 |
51.2 |
|
MAY |
40.9 |
44.8 |
46.6 |
48.5 |
45.2 |
|
JUN |
51.6 |
50.1 |
51.7 |
47.0 |
50.1 |
|
JUL |
55.0 |
53.3 |
51.9 |
58.5 |
54.7 |
|
AUG |
43.5 |
45.6 |
53.6 |
47.0 |
47.4 |
|
* Current and Future Components with equal weights | |||||